CI/CD for TFX Pipelines with Vertex and AI Platform
Deploy a TFX Pipeline with Vertex Pipelines, serve your model on AI Platform, monitor your requests and build a CI/CD pipeline to scale your system
1. Introduction
This article is the second of two parts, the first part is available at Sentiment Analysis with TFX Pipelines — Local Deploy. In the first part, we discussed how to develop the pipeline locally, in addition to showing the process of building a sentiment analysis model.
In this part we will cover how to run our pipeline in a Cloud environment, how to develop a CI/CD pipeline for TFX Pipelines and how to monitor our model’s serving requests.
By the end of this article, you will be able to:
- Create a sentiment analysis model
- Create a TFX pipeline integrated with Vertex AI
- Serve your model in a cloud environment through a REST API
- Analyze your pipeline metadata
- Create a CI/CD pipeline
- Analyze inferences using BigQuery
The code for the entire application is available in this GitHub repository.
2. Vertex AI + TFX Pipelines
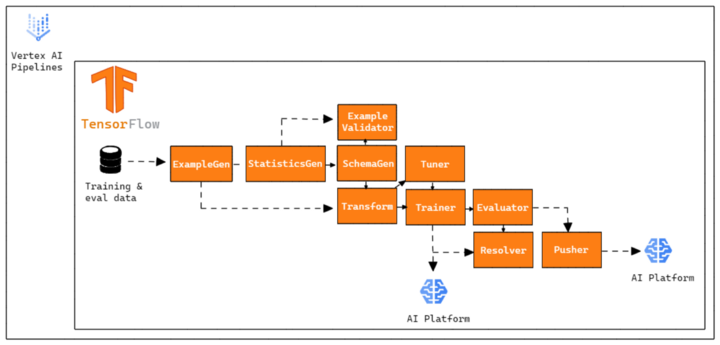
In the first part, we explain what a TFX Pipeline is, what its components are and how our model works. Now, let’s focus on how to make this pipeline available in a cloud environment and how to build a CI/CD pipeline to scale our system.
When deploying a model, we need to think about how we are going to make it available to the end user. One of the most used ways is through requests in a REST API.
In this tutorial we will deploy our pipeline using the services of Google Cloud Platform (GCP), and in general, we will use two main services:
2.1 Vertex AI
Vertex AI is Google’s new AI platform and unites all Google Cloud services to build ML. We are going to use Vertex Pipelines to run our training pipelines, for two main reasons:
- It is cheaper — in our case — than AI Platform Pipelines. Vertex Pipelines have fixed execution rates per run, also associated with the costs of training the model through Compute Engine. No need to activate and manage clusters, making infrastructure leaner and cheaper.
- Unlike Google Kubernetes Engine (GKE) used in AI Platform, we don’t need to manage the infrastructure/health of servers and clusters as the Vertex is a self-managed platform.
2.2 AI Platform
Although our pipeline runs using Vertex Pipelines, our model will be trained and served on the AI Platform for one main reason:
Up to that date, it is not possible to inform the subscription of a SavedModel TensorFlow through the function predict in Vertex AI.
Therefore, our pipeline was built to work as follows:
3. TFX Pipeline on Cloud
Now, let’s understand how we are going to migrate our pipeline to a Cloud environment.
3.1 Configuring the Project
Important: this project will have costs. New Google Cloud users may qualify for a free trial.
First of all, you need to create a project in Google Cloud Console and enable the following API’s:
- Vertex AI
- AI Platform Training & Prediction
- Cloud Storage
- Container Registry
- BigQuery
- Cloud Build
- Notebooks API
3.2 Pipeline Settings
Let’s now open the configs.py file and analyze some variables:
- GCP_AI_PLATFORM_TRAINING_ARGS — Parameters passed to the AI Platform to train our model.
- GCP_AI_PLATFORM_SERVING_ARGS— Parameters passed to the AI Platform to serve our model.
These parameters are added to create the pipeline in the kubeflow_v2_runner.py file
Now, let’s go to the variables that point relative to the paths. Note, in the code, that all variables point to Buckets in Google Cloud Storage, this is because as we are going to build our CI/CD pipeline, these files will be located and available in the cloud environment.
- TRANSFORM_MODULE_FILE — File containing the transformations of the Transform component.
- TRAIN_MODULE_FILE — File containing the instructions for the Trainer component.
- TUNER_MODULE_PATH — Directory containing a best_hyperparameters.txt file containing the model’s hyperparameters.
- DATA_PATH — Directory containing our data.
- LABEL_ENCODER_FILE— File containing our LabelEncoder to transform our target variables.
3.3 Creating a Docker Image for Cloud Build
We need to create a Docker image to be used by Cloud Build. We are creating this image because the Python version provided by the default Python image is 3.9, but the latest TFX version only supports Python 3.8 or less.
Therefore, we must access Vertex AI -> Workbench and create a Notebook to define our image. This step can also be done locally or in Cloud Shell.
Open the terminal and clone the repo:
git clone https://github.com/arturlunardi/sentiment-analysis-tfx
Inside the repository, open the create_first_container.ipynb notebook and run the lines to create the container in the specified path.
After running, you can check the image in Container Registry.
3.4 Creating the buckets
In order for us to be able to copy the files from our repository to Buckets in Google Cloud Storage, we need to create the folders where they will be copied.
Access Cloud Storage in your project and create a Bucket with the following directory structure:
└───{{ GOOGLE_CLOUD_PROJECT }} + '-vertex-default'
    └───{{ PIPELINE_NAME }}
        ├───best_hyperparameters
        ├───data
        └───modules
3.5 Creating a service account
In order for GitHub Actions to be able to perform tasks in Cloud Build, we need to create a service account for authentication.
Create a service account and add the following permissions:
- AI Platform Administrator
- Vertex AI Service Agent
- Service Agent Vertex AI custom code
- Cloud Build Service Account
- Viewer
Then create a key in Keys -> Add Key -> JSON.
One last step is necessary. Since we are going to read files from Google Cloud Storage through the Vertex AI service, we need to give read permission to the Vertex AI service account.
Then go to IAM and admin -> Check Include role grants provided by Google on the right -> Find the account named: AI Platform Custom Code Service Agent -> Add the Viewer role.
3.6 Setting Secrets in Git Repo
Our CI/CD Pipeline will use some variables that are secret, so we need to add them.
Go to your repository -> Settings -> Secrets -> Actions and create the following secrets:
- GCP_PROJECT_ID: your project id
- GCP_CREDENTIALS: copy and paste the entire contents of the JSON key of the service account created above
4. CI/CD Pipeline
According to Park, C.; Paul, S.², in software engineering, Continuous Integration (CI) and Continuous Delivery (CD) are two very important concepts. CI is when you integrate changes (new features, approved code commits, etc.) into your system reliably and continuously. CD is when you deploy these changes reliably and continuously. CI and CD both can be performed in isolation as well as they can be coupled.
To make our system scalable, we need to work with CI/CD practices. This will allow us to apply experiments, integrations and deploys much faster and more reliably. Let’s analyze a few scenarios:
- With new data available, how do I retrain my model regularly?
- When adding new features, how do I make sure my system won’t break?
- After deploying my model, how do I test the prediction service through the API to ensure that inputs and predictions are being interpreted correctly?
Implementing ML in production doesn’t just mean making the model available through an API, but implementing a scalable, change-adaptive pipeline that allows for rapid experimentation and provides accurate results. If you want to learn more about CI/CD pipelines and their importance, I recommend this Google article, MLOps: Continuous delivery and automation pipelines in machine learning.
In this project, our CI/CD pipeline will work as follows:
- We create a Github repository, containing all the code for our TFX Pipeline that will run on Vertex AI.
- We set up a flow on GitHub Actions, which will trigger every push to the master branch, and will check for changes in specific directories of our repository.
- If there are changes, take a specific action for each type of change.
The following YAML file defines a GitHub Actions activated by a push to the master branch.
Let’s understand an important point: the dorny/paths-filter of GitHub Actions allows us to detect if there have been changes in certain paths made with push.
In this case, we are looking at two paths: tfx-pipeline and modules:
- If there have been changes to the tfx-pipeline path, start a Cloud Build Process with the settings provided in the build/full-pipeline-deployment.yaml file, using the environment variables via — substitutions.
- If there have been changes in the modules path and there have been no changes in tfx_pipeline (to avoid duplicate runs), start a Cloud Build Process with the settings provided in the build/partial-pipeline-deployment.yaml file, using the environment variables via — substitutions.
Let’s now carefully analyze the two files.
4.1 full-pipeline-deployment.yaml
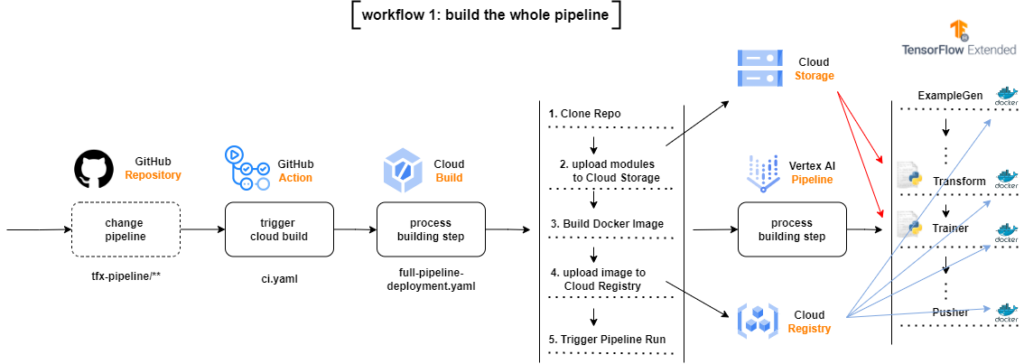
If there are changes in the directory that contains files related to pipeline settings, the flow will start a Cloud Build Process, which will clone the entire repository, copy only the changed modules to the modules directories in Google Cloud Storage Bucket, build a new Docker image based on the code changes, upload the new image to a Google Container Registry and submit the TFX Pipeline in Vertex AI.
It may be difficult to read the first time, but if we go through it step by step we understand what is happening:
- We clone the entire repository
- We copy some files from this repository to the specified Buckets
- We compile the pipeline to check if everything is ok
- We create the pipeline with tfx pipeline create
- We create the run in Vertex AI with tfx run create
There are three important points in this file:
- the — build-image flag in tfx pipeline create is used to create a new Docker image of our environment
- the Docker image used by cloud build is gcr.io/$_PROJECT/cb-tfx:latest, that is, the image we created in step 3.3
- we set the tfx run create engine to vertex, as we are submitting our pipeline to Vertex AI.
4.2 partial-pipeline-deployment.yaml
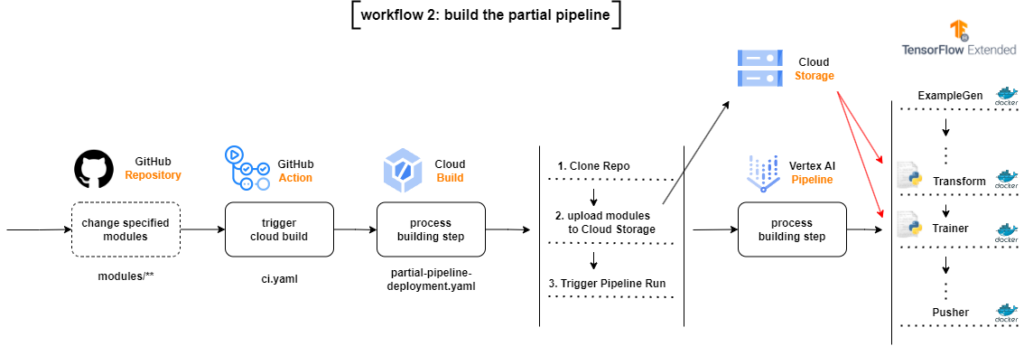
If there are changes in the directory that contain changes to the model code, preprocessor code, training data, hyperparameters or LabelEncoder
- The flow will start a Cloud Build Process, which will clone the entire repository
- Copy only changed modules to module directories in Google Cloud Storage Bucket
- Submit the TFX Pipeline in Vertex AI, no need to build a new Docker image
This file is practically the same as full-pipeline-deployment.yaml, the differences are:
- the — build-image flag in tfx pipeline create has been removed as we don’t need to create a new Docker image
- since there were no changes to the pipeline settings, we don’t need to compile it, removing the tfx pipeline compile
5. Monitoring
When deploying a model into production, we need to constantly monitor it. Our model has been trained on a certain dataset, so to maintain performance, the data it will be exposed to must have the same distribution.
As models do not operate in a static environment, their performance may degrade over time due to deviations between the training data and the prediction data. Some examples of deviations may be:
- Introduction of a new vocabulary (a new language)
- Change in measurement units (meters to km)
- Change in consumer behavior due to some external event (pandemic)
As the model was not exposed to these changes, the tendency is that the performance is affected. So we need to monitor:
- How data changes over time
- When it is necessary to retrain the model to capture the new patterns
- Whether the data being ingested is the same as my model was exposed to
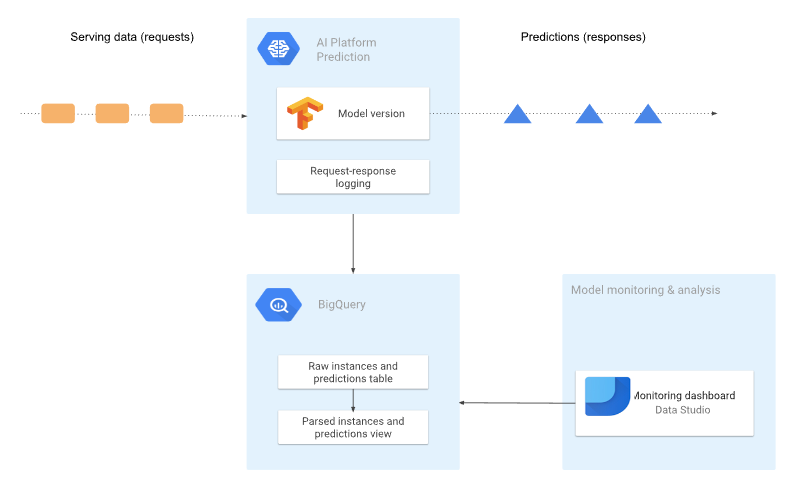
In this example, we are going to log all request/response logs from our model. Our model will be available on the AI Platform, and the records will be saved in a BigQuery table in raw format (JSON).
The architecture we are going to create is shown in the following diagram:
5.1 Enabling request-response logging to BigQuery
By default, the AI Platform Prediction prediction service doesn’t provide logged information about requests because the logs incur cost. Models can receive a very high number of requests, incurring considerable cost, so we need to explicitly enable registrations. The code is available in the activate_logging_requests.ipynb file.
Before enabling logs, we need to create a BigQuery Table to hold logs.
Every table needs to be inside a BigQuery Dataset, so we define the dataset and table name and create the dataset.
Afterwards, we define the data schema expected by the table.
We create the table. Note that we don’t set any expiration time for the table, if you want to know more about it, go to documentation.
Now we can enable logging for our model. An important point is that we need to define the version of the model that we want to activate the records. For each version of the model, we need to explicitly enable logging.
We search within our model for the latest version.
And finally, we enable logging. The samplingPercentage argument defines the percentage of requests that we want to record, in our case we set 1.0, that is, we record 100% of the records.
In our table will be all records, in raw form, of all versions of our model.
5.2 Visualizing our data
As we see below, our data is recorded raw, in JSON format.
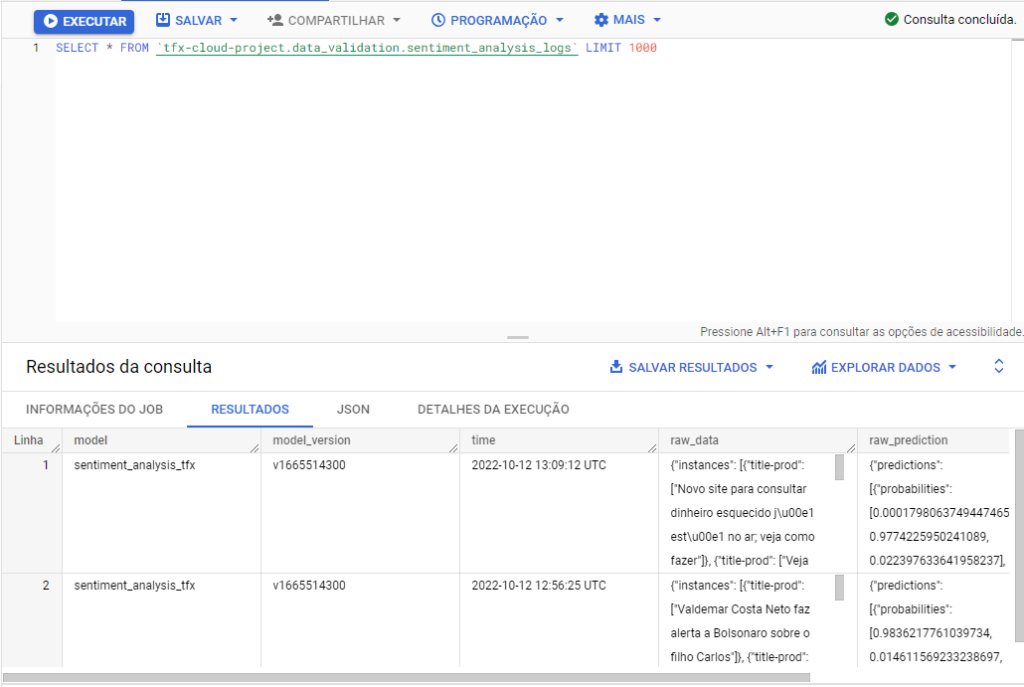
To improve our view, we can create a specific view of our data. Let’s understand the BigQuery table schema.
https://gist.github.com/arturlunardi/567340f91a68d6d6b30d649aed28b126#file-schema_bigquery_table-csvIn the following table, we show an example of the data stored in the raw_data and raw_prediction columns of the BigQuery table, respectively.
Now, in the file create_view.py we define the creation of the view. First, we create some helper functions.
Afterwards, we define the function that will create the view, receiving all parameters. Let’s break it down into four parts:
1. We define the features and the target variable.
2. We define two variables json_features_extraction and json_prediction_extraction. These variables contain the attributes and prediction values in a format that can be entered in an SQL statement.
3. We create the sql_script variable, which contains the CREATE OR REPLACE VIEW statement. The statement contains several markers, which are marked in the string using @ as a prefix.
4. Finally, we replace the markers in the SQL statement with the variables defined earlier and create the view.
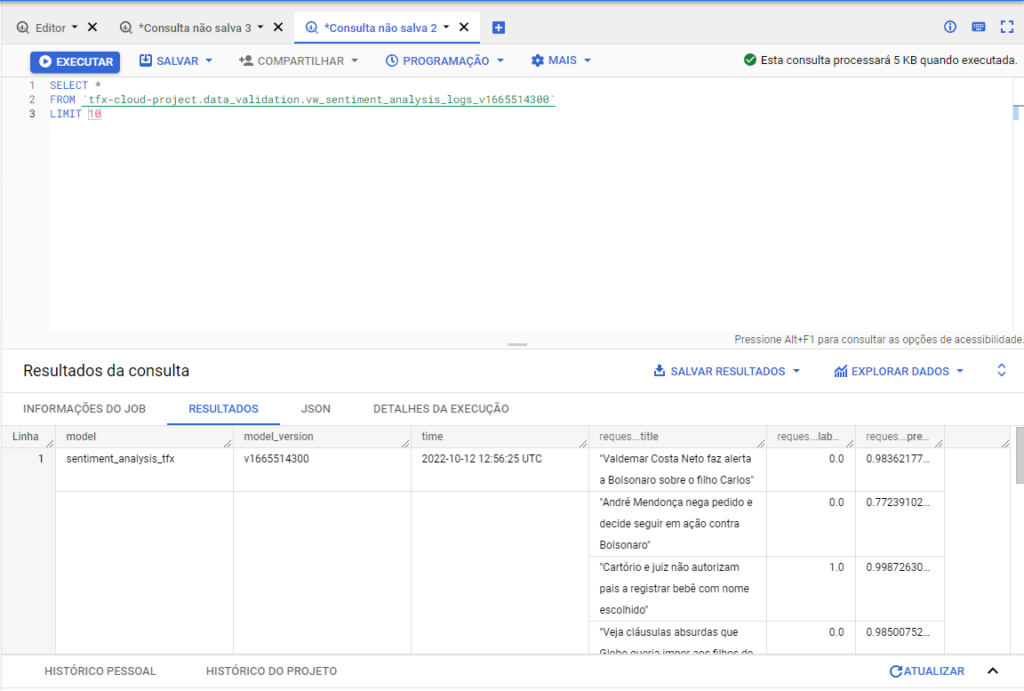
Now we can access the BigQuery console and access our data.
And the output is similar to this.
We may also use Google Looker to create interactive dashboards and visualizations of our data.
To clean up all Google Cloud resources used in this project, you can delete the Google Cloud project you used for the tutorial.
6. Conclusion
Developing pipelines in a cloud environment allows our system to become scalable and less prone to errors. Deploying the model is just a part of the whole process, to maintain the performance of our predictions we need to constantly monitor the inferences and analyze what data is being sent to our model.
CI/CD pipelines provide responsiveness to our system, allowing for faster test cycles, greater reliability in model deployment, improved code quality and shorter feedback loops.
7. References
[1] MLOps: Continuous delivery and automation pipelines in machine learning (07 January 2020), Google.
[2] Park, C.; Paul, S. Model training as a CI/CD system: Part I (6 October 2021), Google.
[3] ML model monitoring: Logging serving requests by using AI Platform Prediction (12 March 2021), Google.
[4] Analyzing AI Platform Prediction logs in BigQuery (12 March 2021), Google.
[5] Di Fante, A. L. How I deployed my first machine learning model (15 December 2021), arturlunardi.
[6] TFX on Cloud AI Platform Pipelines (05 November 2021), TensorFlow.
[7] Simple TFX Pipeline for Vertex Pipelines (08 December 2021), TensorFlow.