Build a ML Web App with Streamlit and Pipelines
Wrap your processes in a scikit-learn pipeline, learn how to build a ML web app with streamlit, and provide a user-friendly interface
1. Introduction
Companies have a great interest in communicating their solutions to their clients. It is in the interest of people to know how the model works and how it behaves when it is presented to new data. When you build your model and provide it iteratively, it approximates your company with the clients. So in this article, we are going to build a ML Web App with Streamlit and scikit-learn Pipelines to provide a user-friendly interface.
Analytics Dashboards and/or Web Applications are common ways of presenting it, and there are a lot of options to work with, like Tableau, PowerBI, Flask, Django etc. However, these types of applications are often time consuming and with higher cost involved.
A good alternative to the more traditional approaches, then, is using Streamlit.
Streamlit is an open-source Python library that makes it easy to create and share beautiful, custom web apps for machine learning and data science.
Our Web App will be able to:
- Perform a exploratory data analysis (EDA)
- Predict rental prices through user inputs on 20 machine learning models
- Do the model evaluation for each one of these models
The code of the application and the building of the models is available in a Github repository. The app is also deployed on Streamlit Share, publicly available under this link.
2. Model Overview
In this topic we will discuss the decisions regarding the building of the models.
2.1 Data
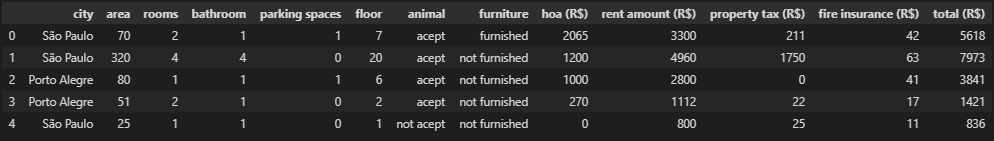
We will work with a Kaggle dataset, provided from this source. It is a csv file with 10.962 registers and 13 features. Our target variable is rent amount (R$), therefore it’s a regression problem.
2.2 Structure
Our goal when build the Web App with Streamlit is to reduce complexity and provide a user-friendly application. Therefore, we need to perform all the steps of the model building before deploying and store it in an easy way.
There are 6 steps to define the model:
- EDA
- ETL
- Data Cleansing
- Feature Engineering
- Model Definition
- Model Evaluation
All steps were performed using jupyter notebooks. For the ETL and the data cleansing steps, new csv files were generated to differentiate from the original.
2.3 Model Definition
One good practice in developing machine learning models is to use pipelines. We chose to use the Pipeline class by scikit-learn, that according to the documentation:
The purpose of the pipeline is to assemble several steps that can be cross-validated together while setting different parameters.
Pipelines provide a logical sequence of steps that can provide a consistent transformation that will assure us that every piece of data is going to follow the same steps.
“Collectively, the linear sequence of steps required to prepare the data, tune the model and transform predictions is called the modelling pipeline.” — Jason Brownlee
2.3.1 Pipeline Steps
When we are building our model, we have to define the transformations that we are going to perform on the data and the combinations that we want to compare. There are transformations that are made in every combination and others that we iterate through.
In this example, we chose to compare the results according to the creation of new features and target transformations. Therefore, there are 4 combinations.
Let’s enumerate the steps of the pipeline. The ones with * are part of the combination. The select K features step is exclusive to work with neural networks, which we are going to cover ahead.
- Feature Engineering*
2. Preprocessing
3. Select K Features
4. Model
5. Target Transformer*
Now, let’s go through every step.
2.3.1.1 Feature Engineering
Feature Engineering is an import part of the process and can help the model to better understand the underlying relations of the data.
In our example, we will create a class named FeatureCreation, it will be passed as a step to the pipeline and will create features inside the pipeline, leaving our original dataset intact. We are going to use the BaseEstimator and TransformerMixin classes from scikit-learn, our class will inherit from these classes since they give us pre-existing methods for free.
2.3.1.2 Preprocessing
Preprocessing it is important to make the data suitable for the models. We chose to apply One Hot Encoding into the categorical features and standardize the numerical features. We used the ColumnTransformer class, which wraps the steps.
2.3.1.3 Select K Features
This step is exclusive to Neural Networks. To create a neural network, we have to specify the input dimension of it and since we are creating features and performing transformations such as one hot encoding, we can’t ensure the exact number of features that will exist.
One way around that is to define a fixed value of variables that will be passed, and this is possible by using SelecKBest from scikit-learn. This function scores the variables according to the function passed, in our case, f_regression, and returns the k variables defined. With the number of features, we just pass the input dim to the neural network and create another step in our Pipeline.
2.3.1.4 Model
This step is very straightforward, we only provide a model to the pipeline. In this example, we chose to work with 5 models to see the performance of each one, they are:
- RandomForest
- XGBoost
- LGBM
- Ridge
- Neural Network
These models were chosen because they have different work mechanisms, RandomForest performs bagging, XGBoost and LGBM performs boosting, Ridge is a linear model and Neural Network have it own architecture.
Since we have 4 combinations and 5 models, we were going to end up with 20 trained models.
2.3.1.5 Build the Pipeline
Now, just instantiate the Pipeline and create the steps. The steps follow a logical sequence and will be performed one after the other.
2.3.1.6 Target Transformer
When we are performing the EDA, we explore the distribution of the target variable. Often, the distribution doesn’t follow a gaussian, or normal, distribution, therefore we may need to perform transformations to make it as normal as possible so that the model could perform well.
In our case, we chose to perform log transformation before fitting the model, this will reduce or remove the skewness of the variable. The transformer will perform a log transformation before the fitting, and when predict the values, it will perform a exponential transformation, bringing the value back to the original scale.
To perform this, we will use the TransformedTargetRegressor class from scikit-learn. This object receives a regressor, that is our pipeline with our model and steps, a function and an inverse function.
This closes our process regarding the pipeline steps.
2.3.2 Hyperparameter Tuning and Cross Validation
To achieve better and more consistent results, we could perform a hyperparameter tuning and cross validation in our models.
There are several ways of performing a hyperparameter tuning, the most known are grid search and random search.
In this example, we chose to use random search instead of grid search because researchs shows that random search does a better job with less resources. Every model will have it own grid, that are the parameters that we want to optimize and the range of values available.
Now, we iterate through every model and store the results. The RandomizedSearchCV returns the model with the best params, then we can store it.
For validation, we will use K-Fold Cross Validation. That means that the data will be divided by K groups of samples, called folds. Then, in every iteration of K, the data will be trained in K-1 and tested in the rest. Our metric for evaluation is RMSE.
Now, it’s just iterate through every model again, perform the cross validation and store the metrics. Don’t forget to fit the model if you want to save it.
2.3.3 Model Saving
In the topics above we have performed the model definition steps, but to work with it in a web application, we need to save our models and load them later. There are several methods to serialize a model and save it, in this example we chose to work with Pickle.
Since we are working with Pipelines and TransformedTargetRegressor objects and also with Keras models on neural networks, we have a few particularities.
Keras models aren’t serialized by pickle, so we need to save it directly into a different file and reset the parameter inside the pipelines to avoid generating a error.
When we are working with pipelines, we must access the step where the model it is stored to save it. With TransformedTargetRegressor it is similar, but we need to take a further step and access the regressor parameter before access the model step.
Later, we have to reconstruct the pipeline loading the Keras models and putting it back together into the steps.
Later, in the model evaluation, we have to identify what file corresponds to each model. To do that, we created a dataframe with every model, it’s metrics and file name, so we can identify them later.
Now, we have every model trained and stored in a file. To perform a prediction, just load the file and use the predict method that our pipeline will do the rest.
3. Web App with Streamlit
It’s time to release the creativity, let’s build our Web App with Streamlit! Streamlit runs on top of a python script and allows you to rapidly build a user-friendly interface. We will not cover every aspect of the script, just an overview of how it was structured and how it works.
3.1 Data Flow
Streamlit has an unique way of handling the data flow. Since you don’t have to make any callback to your app, everytime that something changes in your code, like a variable or the arguments of a function, streamlit will rerun your script entirely.
This ease comes with a cost, if your app has costly operations, like loading data from a database or a big graph, it may compromise your performance. And that’s why streamlit has a st.cache method that can cache a function and store the information about it, if the arguments of that function doesn’t change, streamlit won’t run it again, improving the performance.
3.2 Structure
Streamlit allows you to create multi-page apps easily, interacting with the widgets on the sidebar.
In our app we’re going to have 4 pages.
- Introduction
- EDA
- Model Prediction
- Model Evaluation
In every condition, we can create a unique page, and to navigate through pages, just select the option in the widget.
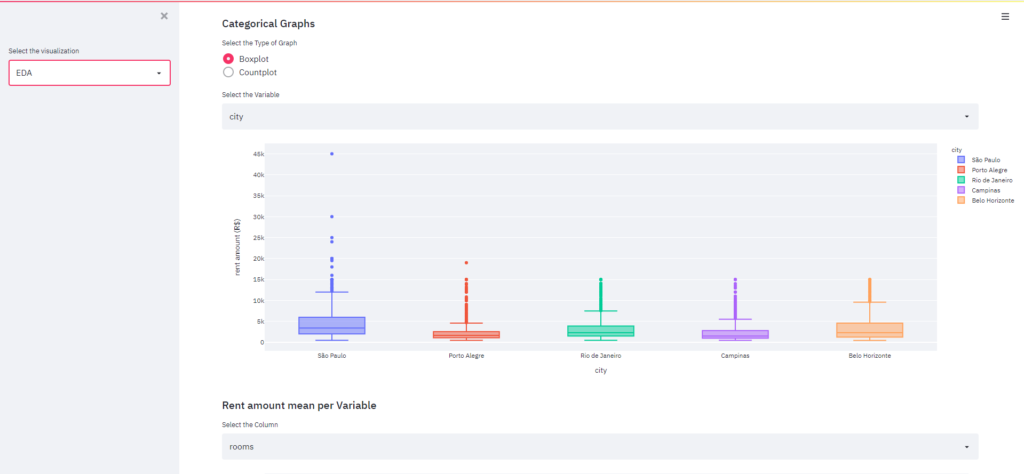
3.3 EDA
In the EDA, we create a widget that the user can select the type of the data, the raw or the cleaned one. The graphs will be generated based on this dataset.
Streamlit supports several different charting libraries, we choose to work with Plotly. We created custom functions for every graphic to customize and cache them.
Now, just import the module and use it inside the app script. Streamlit have specific methods for the libraries, but you also could use st.write. You can play with the widgets and the graph change as the user interacts.
Now, we just have to populate our EDA with the graphics that we want.
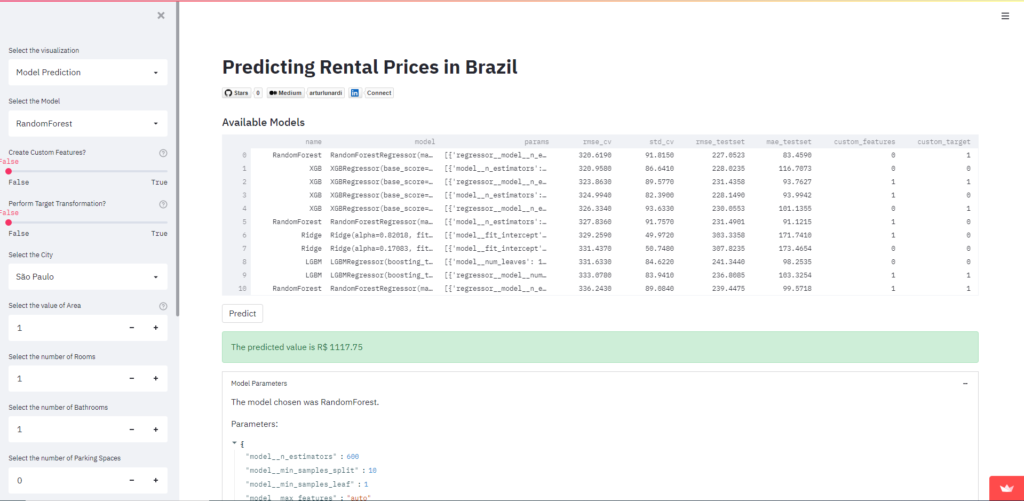
3.4 Model Prediction
To make predictions with the models, we must load them. In the model definition, we’ve created the files and dataframe with each file name for every model, let’s load them.
Notice that we have cached the dataframe that contains the models, this enhances our predictions performance, since we don’t have to load it every time. We’ve also reconstructed the Keras models inside the Pipeline and the TransformedTargetRegressor objects.
Now it’s time to let the user decide what model he wants to use.
Create widgets for every piece of data that will be predicted.
And finally, predict the value with the chosen model and display it along with the model parameters!
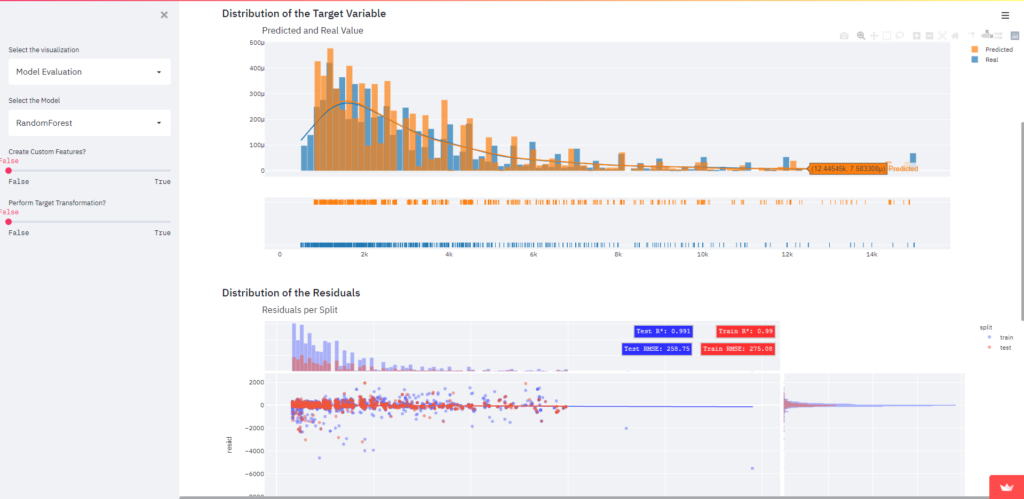
3.5 Model Evaluation
In our model definition notebook, we’ve splitted our dataset into train and test and defined a random state. Now, in the model evaluation we’re going to analyze the predictions of the models based on data that the model has never seen.
First, we just select the model that we want to analyze, similar to the model predict page. Then, we generate the graphs.
We chose to display:
- Distribution of the predicted variables compared to the real values
- Residuals of predictions on the train and test dataset
- Boxplot of the RMSE’s generated by the 5 K-Fold Cross Validation
You can generate graphs and reports to analyze every model separately!
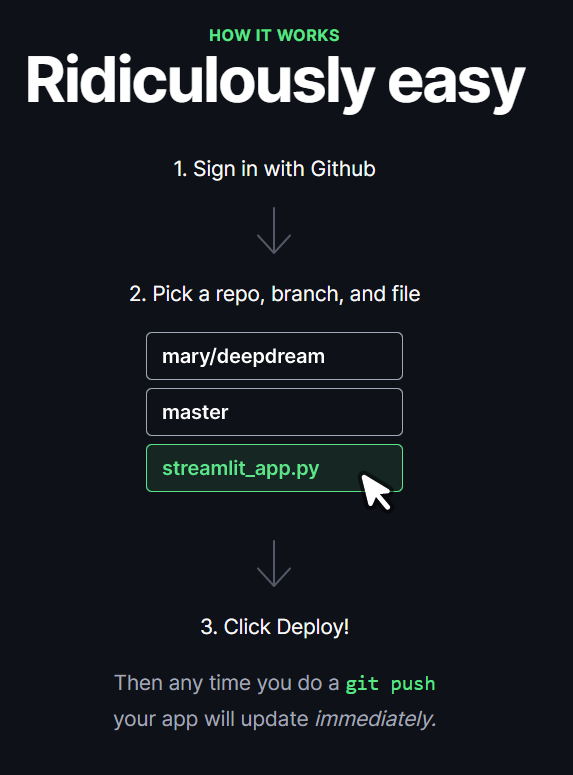
3.6 Model Deploy
Now that the app is build, we just have to deploy it and we do that very easily with Streamlit Share.
You just have to request access, select your github repository, branch and file and click in deploy. After that, your app it’s publicly available and hosted!
4. Conclusion
Communication it’s a crucial skill of a Data Scientist, often the outcomes are complex and hard to explain and presenting it to a non-technical audience is challenging. To illustrate the importance of this topic, Hadley Wickham says in his book R for Data Science:
It doesn’t matter how great your analysis is unless you can explain it to others: you need to communicate your results.
When you deliver a project, the clients are curious not only to see the results, but to know how it works. So we can wrap all our processes inside a scikit-learn Pipeline and build a ML Web App with Streamlit to make the results available with a friendly interface.
5. References
[1] W. Hadley; G. Garret, R for Data Science: Import, Tidy, Transform, Visualize, and Model Data (2017), 1st Edition, O’Reilly.
[2] A. Muhammad, Streamlit Tutorial: Deploying an AutoML Model Using Streamlit (2021), Omdena.
[3] P. Sadrach, A Beginner’s Guide to Building Machine Learning-Based Web Applications With Streamlit (2021), Builtin.
[4] B. Jason, A Gentle Introduction to Machine Learning Modeling Pipelines (2021), Machine Learning Mastery.