How I deployed my first machine learning model
Processes and tools I used to deploy my first machine learning model
1. Introduction
One of the words we hear most in machine learning is the term deploy. The deploy of a machine learning model is nothing more than a process where we make a machine learning model available to other people, and it is precisely at this stage that we see how the model becomes a product.
When making a model available to users, several questions arise, such as:
- How is the model produced and tested?
- How is the model monitored?
- How do I update my model?
- What frameworks and tools do I use?
In this article, I explain a little bit about the production process to deploy my first machine learning model, from the production of a pipeline, model monitoring, delivery to the final user and continuous/delivery integration (CI/CD). The goal is to be direct and focus on the production process, explaining which decisions were taken and why, as well as explaining which tools were used to assist in the model building process. In this article we don’t have any kind of code, just explanations of how the production process was.
2. TFX (TensorFlow Extended)
The model was built with TFX and much of the applied content was learned through the Machine Learning Engineering for Production (MLOps) Integrated Course Program, taught by amazing professionals such as Andrew Ng, Robert Crowe and Laurence Moroney.
“TFX is a Google-production-scale machine learning (ML) platform based on TensorFlow. It provides a configuration framework and shared libraries to integrate common components needed to define, launch, and monitor your machine learning system.” according to the TFX User Guide⁴.
But why did you choose use a not-so-simple framework to deploy your first machine learning model?
There are 3 concepts that are part of MLOps that are very important when dealing with models in production.
- Data Provenance
Where your data comes from, how it came about, and what methodologies and processes were submitted.
- Data Lineage
It refers to the sequence of steps until reaching the end of the pipeline.
- Metadata
It is data that describes data. They serve to explain the characteristics of the item we are looking at. For example, if we’re looking at a photo, the metadata could be what time the photo was taken, what the camera settings are, who took the photo, and so on.
These 3 parts are key in production models as they help track changes that occur in your model’s lifespan. Suppose we have a team to collect and clean the data, another to manage the ingestion, another to create/test the model, and another to deploy it. There are many people working, on different files, in different environments, and this can make the change tracking process very complex if not done efficiently.
Suppose we put the model into production, but after a few versions we found that there was an error cleaning the data. How do we track the data version, what transformations were performed, what were the attributes of the model? How do we reproduce the same environment that data was previously submitted to?
That’s why it’s important to work with frameworks that have some kind of support for these processes. TFX was developed to build and manage workflows in a production environment. Thus, the three main components of TFX are:
- Pipelines
- Components
- Libraries
2.1 Pipelines
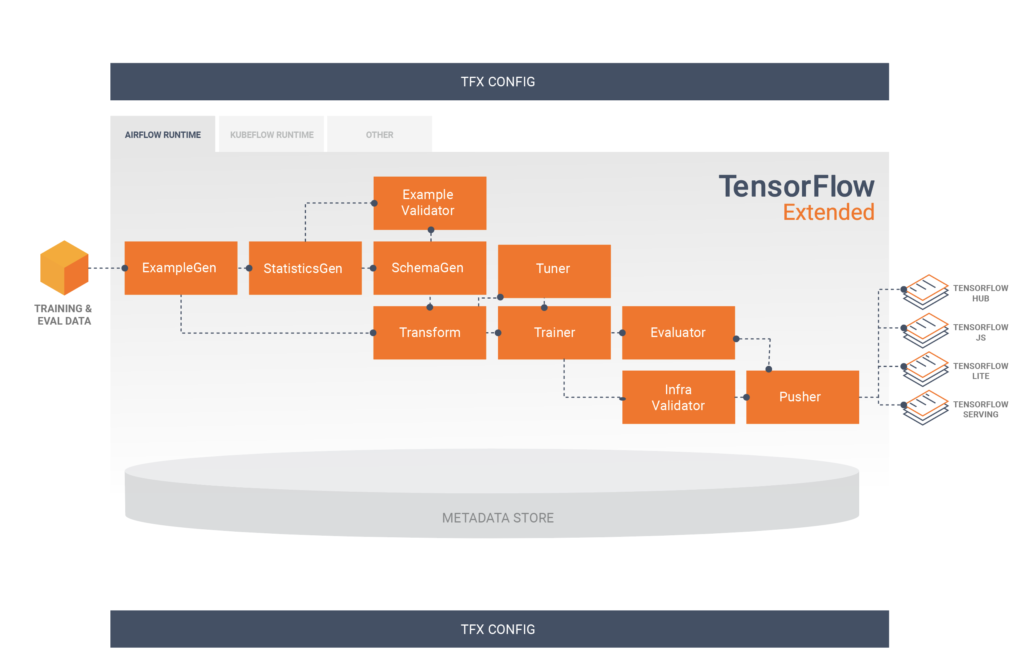
To ensure that the data will follow a logical sequence of steps, there are pipelines. A TFX Pipeline contains a sequence of components, it was designed for scalable and high-performance machine learning tasks. Inside the Pipeline, you could transform the data, train the model, deploy, display inferences and much more. TFX supports several orchestrators such as Apache Airflow, Apache Beam and Kubeflow Pipelines.
2.2 Components
I like to imagine components as lego pieces. You can use it separately or together, and each component is designed for a specific task. There are components that depends on the output of another, so you have to use them in a logic sequence.
To understand how our pipeline was put together, we first need to understand its components. TFX has several tutorials explaining how to use the components. Typically, a TFX pipeline includes the following components:
- ExampleGen is present at the begining and split the data into training and eval datasets, transforming it into the ‘tf.Example’ format. It accepts different formats such as CSV, TFRecord, Avro, Parquet and BigQuery.
- StatisticsGen is responsible for calculate the statistics for the dataset, such as the distribution, max, min, missing values and so on.
- SchemaGen creates a data schema. It shows the expected type of data for each feature.
- ExampleValidator looks for anomalies (values different than the expected) and missing values in training and eval datasets, such as detecting training-serving skew.
- Transform is responsible to carry out all the transformations/creations of variables in our model. An important point of this component is that it generates a graph that stores the global properties of the data, which will be used both in training and in inference, offering reliability.
- Trainer trains the model. In this component we specify where and how the model will be trained, in addition to defining its entire architecture.
- Tuner tunes the model’s hyperparameters. The tuner can be executed in all executions of the pipeline, or it can also be imported, if you want to perform the adjustment of hyperparameters only from time to time.
- Evaluator deeply evaluate the performance of the model. It also validate your models, allowing you to slice your metrics on specific subsets of the data, ensuring that the model is good enough to be pushed to production.
- Pusher push a validated model to a deployment target. This is where we specify where the model will be served.
2.3 Libraries
Libraries are the base that provides the functionality for the components.
Basically, a TFX Pipeline is made up of components, which are made up of libraries.
3. Experimental Tracking and Management
A step that I consider very important in building the model is experimental tracking and management. In building the model, you will run several experiments, which can include:
- different models with different hyperparameters
- different training and testing data
- different features
- minor changes to the code
And these different experiments will yield different metrics. Keeping records of all this information is not a simple task, but a very important one, mainly to follow the model’s progress, comparing different experiments to have confidence in the final result.
And that’s where experimental tracking and management comes in. It’s a process where we save all the information that’s important for each experiment we run. Each project has its own set of information that is important to save, which could include:
- code used for each file
- environment settings
- dataset versions
- hyperparameter settings
- performance metrics
- type of model used
There are several ways to save this information, but for large projects it is very important that you have control over what is being done. For this, there are several tools available, such as CometML, Weights and Biases (WandB), MLFlow .
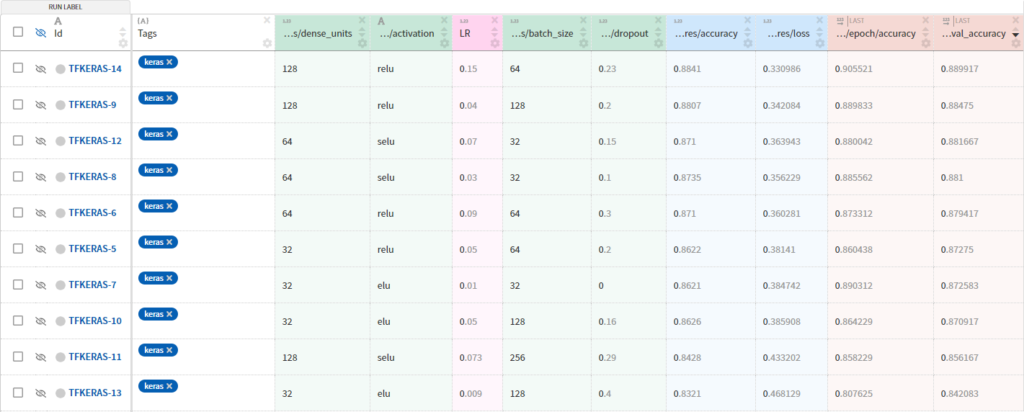
In our project we chose to use Neptune.
“Neptune is a metadata store for any MLOps workflow. It was built for both research and production teams that run a lot of experiments. It lets you monitor, visualize, and compare thousands of ML models in one place.” according to J. Patrycja⁸
Neptune supports experiment tracking, model registration, and model monitoring, and is designed in a way that allows for easy collaboration. It also has TensorFlow integration, making it very simple to monitor all experiments in one place.
4. Model deploy with Vertex AI and TFX Pipelines
When we’re deploying a model, we need to think about how we’re going to serve it to our end user. In our case, we need to make the model available through an API so that we can send requests and receive responses.
To build our pipeline, we chose to work with Google Cloud. As an orchestrator, we use Kubeflow Pipelines, as most tutorials are done through it. There are several tutorials teaching you how to integrate your TFX Pipeline in the Cloud, as in [1], [2] and [3].
We decided to build our pipeline using Vertex AI, Google’s new AI platform platform. We chose Vertex AI for two reasons:
- It is cheaper (in our case) compared to AI Platform Pipelines. Vertex pipelines do not need clusters active all the time, the costs are charged per run and associated with the use of computational resources for training/predicting the model.
- Unlike GKE (Google Kubernetes Engine), we don’t need to manage the infrastructure/servers/health of our components, as it is a self-managed platform.
According to the documentation, Vertex AI Pipelines can run pipelines created using the Kubeflow Pipelines SDK v1.8.9 or later or TensorFlow Extended v0.30.0 or later.
Although our Pipeline runs on Vertex AI, we chose to train and serve our model on the AI Platform. Vertex AI is a recent platform, with limitations that will improve over time, so, as of the writing of this article, there are important features that do not yet exist for served models, such as specifying the signature of a SavedModel TensorFlow when making the predict request.
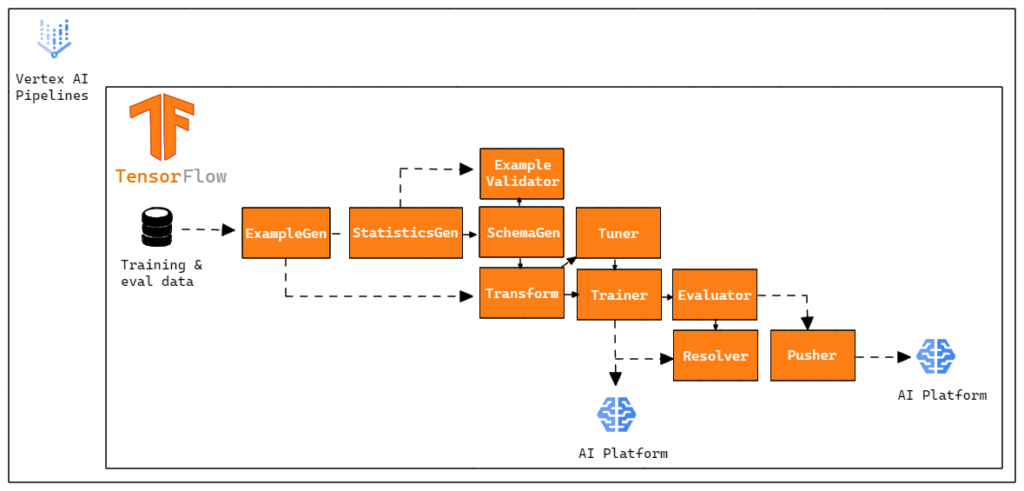
Each component is responsible for a task within the TFX Pipeline and often a component depends on the outputs of the other. In our case, we chose not to use InfraValidator and BulkInferrer components. However, we chose to add one more node to our pipeline, the Resolver. Resolver is a special TFX node that handles solving special artifacts, in our case it was used to specify the latest base model into the Evaluator component.
So our Vertex Pipeline is made up like this:
5. Monitoring
Once the pipeline is executed, our model will be available for forecasting. However, this does not mean that our work is over, but that it has just begun. When you deploy an ML model in production to serve business use cases, it’s essential to regularly and proactively verify that the model performance doesn’t decay. As models do not operate in a static environment, ML model performance can degrade over time. The data distribution can change, causing data skew and consequently the model will have its performance compromised. To maintain the performance of the model in production, it is necessary to register the serving requests and compare it with the training data, verifying whether the model’s predictive capacity has changed.
So, we need to monitor the model. We’ve chosen to log serving requests from our model, this process logs a sample of online prediction requests and responses to a BigQuery table in raw (JSON) format.
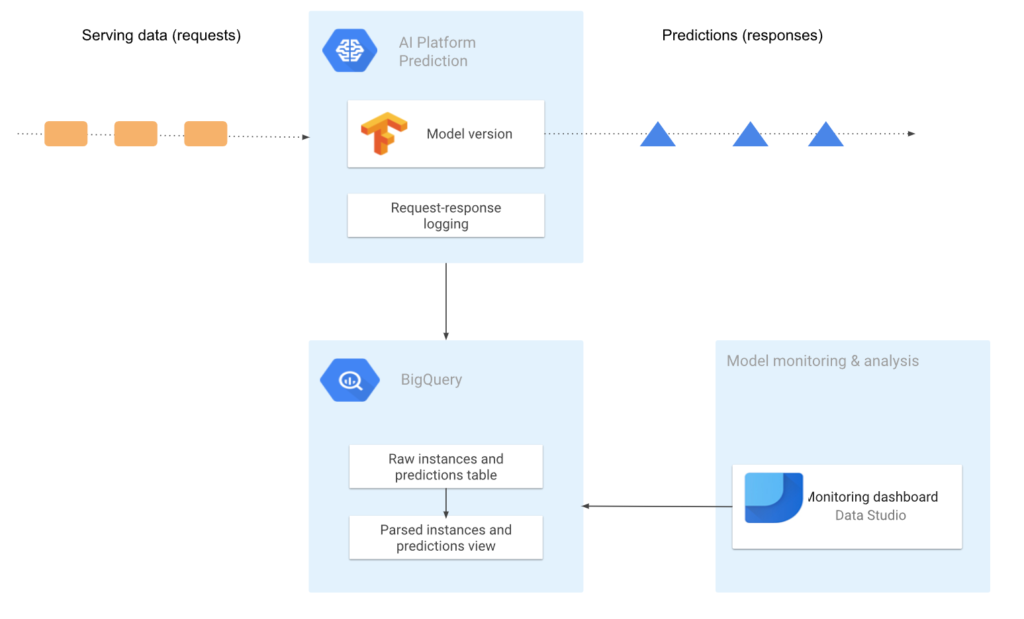
With these records, we can analyze the data, calculate statistics and visualize the deviation of the data. This process is essential to have a model that evolves in a healthy way, serving data can change its distribution and this will lead to a drop in performance in our model, indicating that it is necessary to retrain/readjust the model. As the data will be registered in a BigQuery table, it is very easy to generate visualizations and reports about data distribution and model predictions, an example of a tool to be used is the Data Studio.
6. CI/CD
Now, let’s go to the final step of our project. Imagine that we have dozens of models, with hundreds of files in production, and we regularly need to make adjustments, such as adjusting the dataset, creating variables, retraining the model, tune hyperparameters, etc. How can we automate this process so that any design changes are detected, tested, and the new model is automatically deployed?
“In software engineering, Continuous Integration (CI) and Continuous Delivery (CD) are two very important concepts. CI is when you integrate changes (new features, approved code commits, etc.) into your system reliably and continuously. CD is when you deploy these changes reliably and continuously. CI and CD both can be performed in isolation as well as they can be coupled.” according to P. Chansung; P. Sayak⁶
CI/CD pipelines allow our software to handle code changes, testing, deliveries, and more. We can automate the process of implementing changes, testing and deliverables so that any changes to the project are detected, tested and the new model automatically deployed. This allows our system to be scalable and adaptable to changes, in addition to providing speed and reliability, reducing errors due to repetitive failures. If you want to understand more about the importance of CI/CD and why it is needed for your project, check out this article.
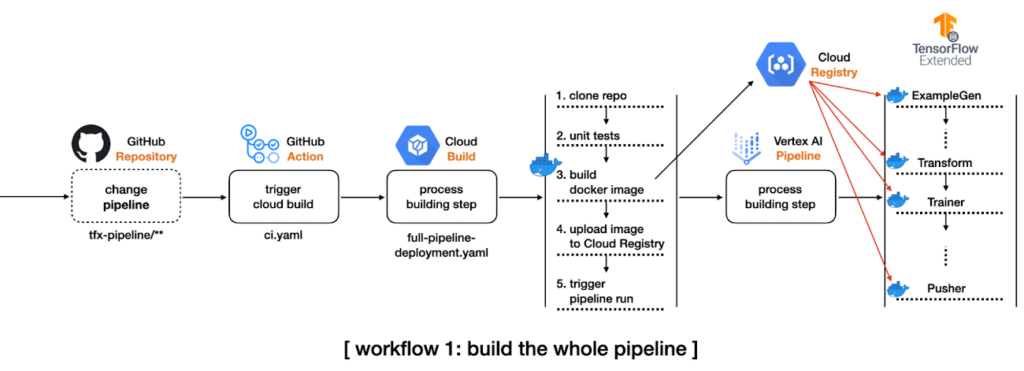
In this project, we created the following CI/CD pipeline:
- We created a repository on Github, containing all the code for our TFX Pipeline that will run on Vertex AI.
- We’ve set up a workflow on GitHub Actions, which will trigger on every push to the main branch, and will check for changes in specific directories in our repository.
- If there are changes in the directory that contain files related to the pipeline configurations, the flow will start a Cloud Build Process, which will clone the entire repository, build a new Docker image based on the code changes, upload the new image to a Google Container Registry and submit the TFX Pipeline in Vertex AI.
4. If there are changes in the directory that contain changes to the model code, pre-processing or training data, the flow will start a Cloud Build Process, which will clone the entire repository, copy only the changed modules to the directories modules in the GCS Bucket and submit the TFX Pipeline in Vertex AI, without the need to build a new Docker image.
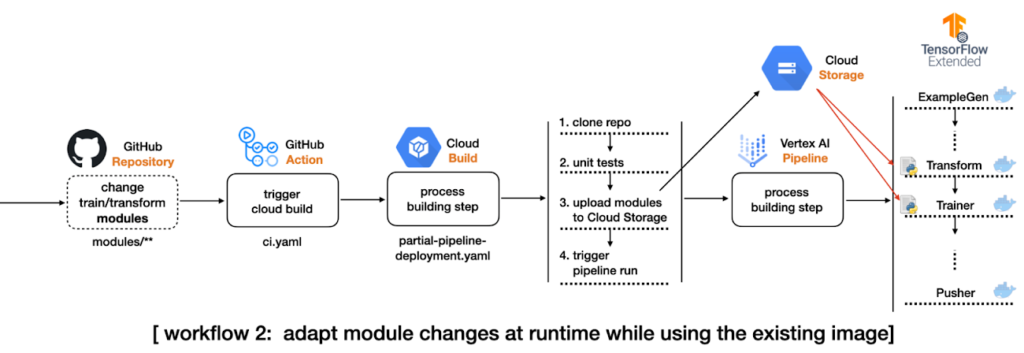
After configuring the pipeline, any push done to the repository will activate GitHub Actions, which will check for changes and automatically run the pipeline, and will deploy our machine learning model automatically. It is important to emphasize that the TFX Pipeline will follow the flow normally, that is, if the candidate model is not approved by Evaluator, for example, the model will not be deployed.
There are several other possible improvements to the CI/CD Pipeline, such as:
- Training data validation
- Unit testing of the different modules, such as acceptable data types, expected amount of data, etc.
- Test if model outputs do not produce null values
- Test the prediction service by calling the service API with test data to verify that the model is working correctly
- Automatic deployment of a pre-production environment, for example, a code-merge-triggered deployment to the main branch after reviewers approve changes
7. Conclusion
Deploy a machine learning model and make it available to users is not an easy task, building the model is just the first step. Deploy our first machine learning model and maintain our model’s performance, we need to monitor your predictions and offer alternatives that make our process scalable and adaptable to change. In addition, it is important that we keep data regarding the execution of the pipelines, so that our processes are reproducible and that the error correction process is efficient. Using tools that support the process is essential to abstract the project’s complexity, making it more scalable and easier to maintain.
8. References
[1] TFX on Cloud AI Platform Pipelines (05 November 2021), TensorFlow.
[2] O. Rising, Deep Dive into ML Models in Production Using TensorFlow Extended (TFX) and Kubeflow (12 November 2021), Neptune Blog.
[3] Simple TFX Pipeline for Vertex Pipelines (08 December 2021), TensorFlow.
[4] The TFX User Guide (14 December 2021), TensorFlow.
[5] MLOps: Continuous delivery and automation pipelines in machine learning (07 January 2020), Google.
[6] P. Chansung; P. Sayak, Model training as a CI/CD system: Part I (6 October 2021), Google.
[7] ML model monitoring: Logging serving requests by using AI Platform Prediction (12 March 2021), Google.
[8] J. Patrycja, 15 Best Tools for ML Experiment Tracking and Management (25 October 2021), Neptune Blog.

