
Utilizing Data to Find a New Home in São Paulo
Utilizing data to find a new home in São Paulo: gather information, filter houses based on your preferences and enhance your search
1. Introduction
1.1 Background
The average brazilian move approximately six times in their lifetime. Almost everyone have experienced a period of searching for a new house. There are many different options and sources to search for, it’s almost impossible for us to look one by one. In this article, we will be utilizing data to find a new home in São Paulo and enhance our search.
1.2 Problem
We received a job offer in São Paulo. Since this offer it is for a specific address, we have selected a few close neighborhoods to live in. Although we have selected these neighborhoods, still there are a lot of apartments for rent. We have a few exigences regarding the nearby venues, and that will be taken into account to choose our home.
Based on definition of our problem, factors that will influence our decision are:
- the apartment must have at least 2 bedrooms
- the monthly value of the rent cannot exceed R$ 1.700,00
- it has to be at least 5km from workplace
- it has to be near at least 1km from a gym and a market
- social and economic characteristics of the neighborhod based on the available data
We will use our techniques in data science to generate the most promissing apartments for us to live in. Economic data and social characteristics of the neighborhoods will be considered in the proccess.
1.3 Interest
This project is targeted to everyone that might be interested to know more about rent prices of apartments, statistics of the neighborhoods or just want to move to São Paulo, Brazil.
2. Data
For this project, we’ll be utilizing data to find a new home in São Paulo. Therefore, we need data.
2.1 Data Sources
Following data sources will be needed to extract/generate the required information:
- coordinate of workplace will be obtained using geocoder
- economical and location data of rental properties around the workplace will be obtained through webscraping of a major online portal.
- nearby venues around each neighborhood will be obtained using Foursquare API
From our properties data we could extract:
- type
- neighborhood
- rent value
- condominium value
- property tax
- bedrooms
- suites
- bathrooms
- parking spaces
- private area
- furnished
- amenities
- latitude
- longitude
From the Foursquare API we could extract:
- Neighborhood
- Neighborhood Latitude
- Neighborhood Longitude
- Venue
- Name of the venue e.g. the name of a store or restaurant
- Venue Latitude
- Venue Longitude
- Venue Category
2.2 Data Cleaning
Since our rental data was scraped through a online portal, the values were early filtered for neighborhoods near our starting point. There were a lot of missing values, specially location data. All the properties that didn’t have the full address with street, number and neighborhood were dropped from the dataset. Some properties had the address but didn’t have the latitude and longitude filled, to fix this we used the geocoder library for filling these fields. Other fields that were missing such as rent value, area, property tax etc., were not dropped.
In our neighborhood and venues data, the data only needed to be grouped.
3. Methodology
3.1 Filtering the distance to workplace
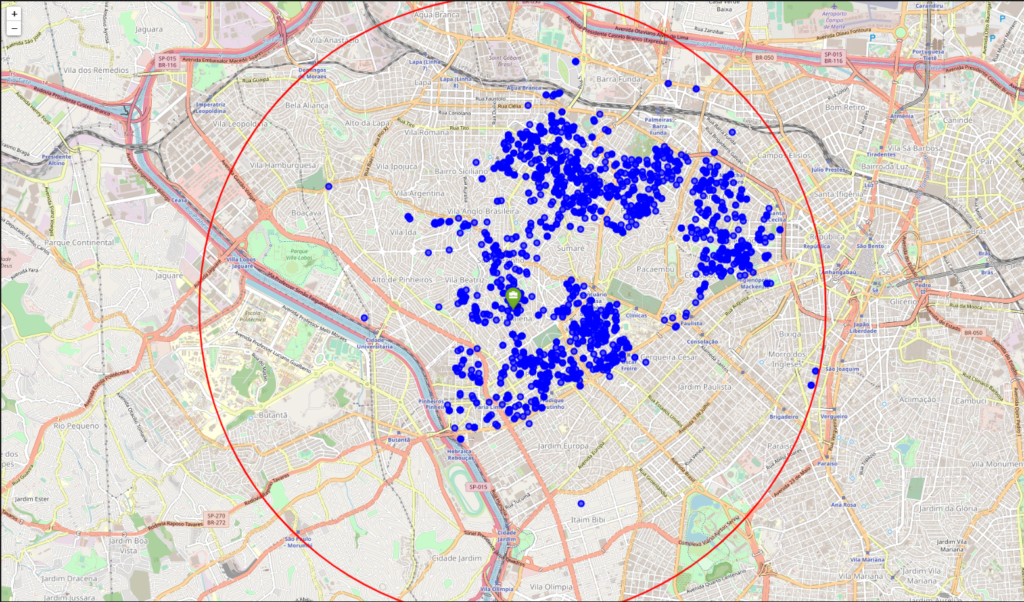
The first filter was made with the aim of get only apartments in a 5km radius for our workplace. It did not filter a lot of properties (~0.33%) and that’s due we already had filtered the neighborhoods to scrape the data.
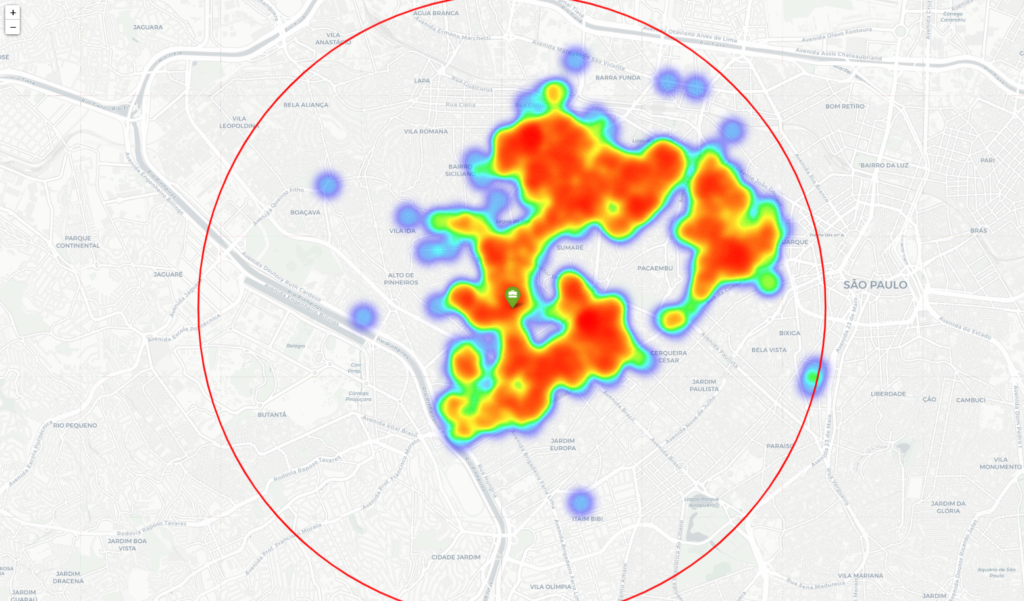
To complement our visualization, a heatmap was created to see the distribution through neighborhoods.
3.2 Extracting specific venues
To extract the data for our venues, we selected each neighborhood in our properties dataset and used the geocoder library to extract the location of each one. Then we create a function to access the Foursquare API and return the 100 nearest venues to each neighborhood. The Foursquare API return the venue name, latitude, longitude and it’s category. We then filtered for our specific venues and created a map with all of our apartments, gyms and markets.

3.3 Grouping data of venues and neighborhoods
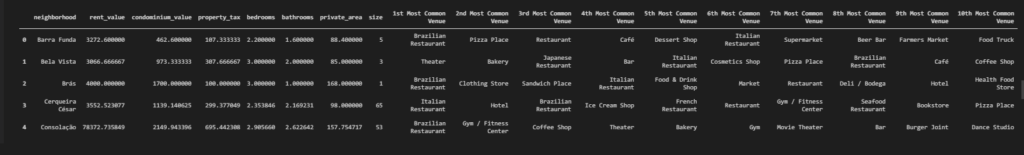
With the category of the venues, we grouped the dataset to see wich were our 10 most common venues to each neighborhood, defining it’s social characteristics. With our properties dataset, we grouped it on the neighborhoods to extract it’s economical characteristics such as average rental value, average private area, average number of bedrooms etc.
3.4 Clustering
We decided to cluster our neighborhoods into 5 groups utilizing k-means algorithm to compile the information into macro-groups. Apparently the neighborhoods are too similar or we didn’t have enough data for the algorithm to perform well, resulting in a single group with approximately 64% of the results.
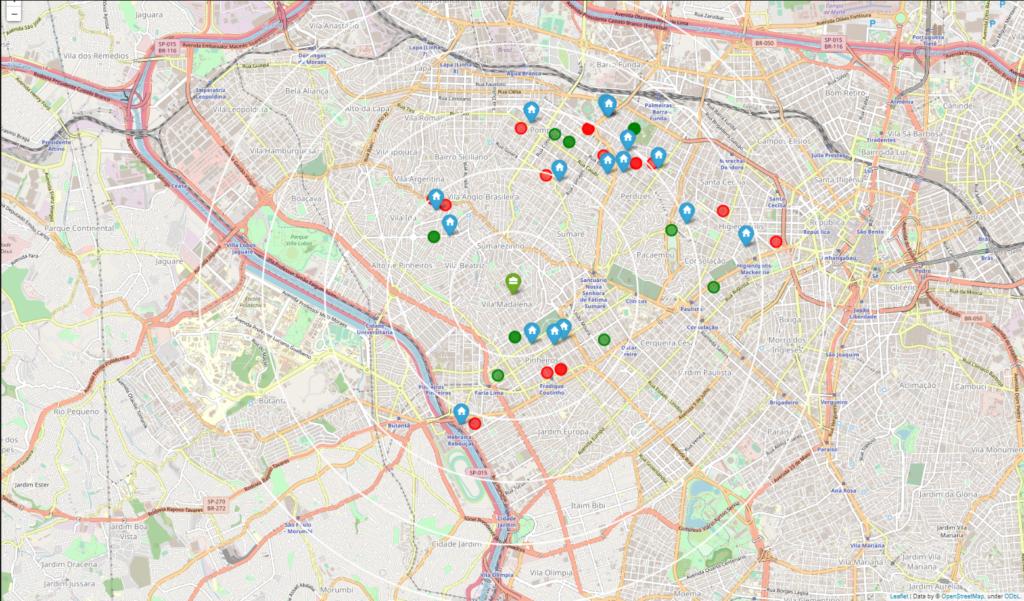
3.5 Potential apartments
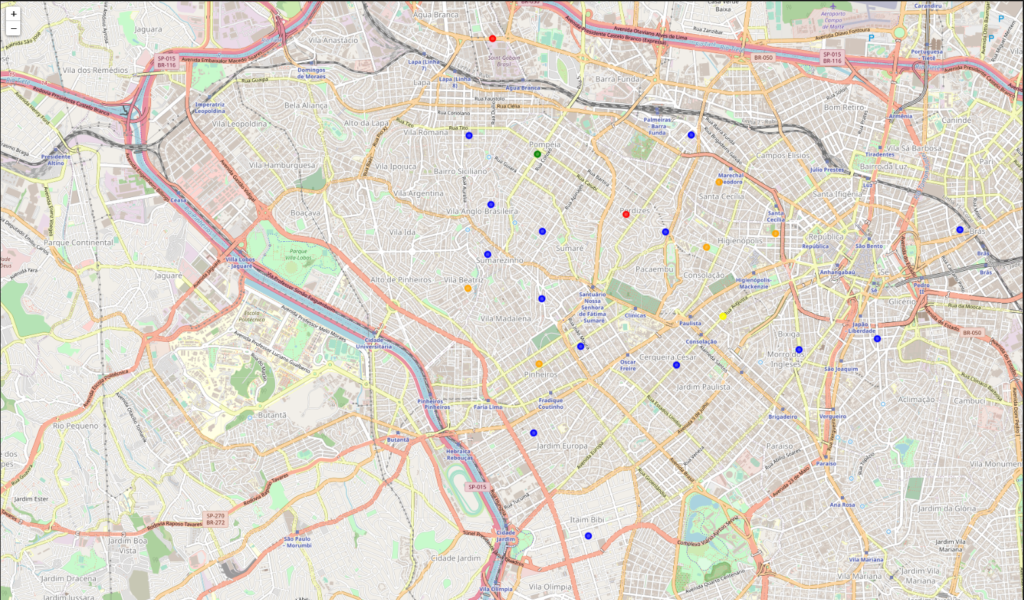
To fit our profile, our new home must be near at least 1km from a gym and a market. To do this, we created two datasets with the information of all the gyms and all the markets in our extracted venues. Later, we iterate through every apartment and every venue to calculate the distance between them and extracted the nearest venue of each specific one. With this we could create a map with all of our apartments and the nearest gym and market for each one.
3.6 Final Dataset
With the social and economical data of each neighborhood, we were able to create a single dataset with every single potential apartment merged with the data of the respective neighborhood, resulting in a single dataset with all the information collected.
4. Results and discussion
Our analysis show that although there are a great number of apartments (~3.000) in our original dataset, just a few (17) fits our profile. Our first filter with the aim of get only apartments in a 5km radius for our workplace did not filter a lot of properties (~100) and that’s due we already had filtered the neighborhoods to scrape the data.
The heatmpap show that there are clearly concentration of the apartments in the neighboorhods that we early filtered, resulting in a little bias in our results. To next projects we could consider get all neighborhoods in a 5km radius from our starting point.
After we grouped the economic and social data of the neighborhoods, we clustered the neighborhoods into 5 groups. Apparently, the neighborhoods are very similar to each other, resulting in a high concentration in one of the groups (~64% of the neighborhoods).
To find our potencial apartments, we applied the final filters regarded as number of bedrooms, minimum distance from specific venues and maximum monthly rent value. The filter were very effective, filtering approximately 99,4% of the results.
To generate our final dataset, we grouped every apartment data with the information of the nearest venues of interest and the economical and social data of the neighborhood. This provided us with a broad view of the characteristics of each apartment and its surroundings.
5. Conclusion
The objective of this project was to find the best apartment for rent in São Paulo that fits our profile. By putting together data of apartments in near neighborhoods and extracting the social and economic data from these neighborhoods, we have generated a concentrated dataset with the most promising apartments to live in.
The final decision should always be taken carefully after looking at each apartment individually. The project was helpful to filter the great number of apartments and grouping together the data of every potential apartment and the social and economical data of it respective neighborhood. Data of quality of life, criminality, urban mobility etc was not taken into consideration and could be interesting indicators to look after in next projects to improve the analysis.
All the code it’s avaible on my github repository.